Annual Temperature Trend 1958 onwards:
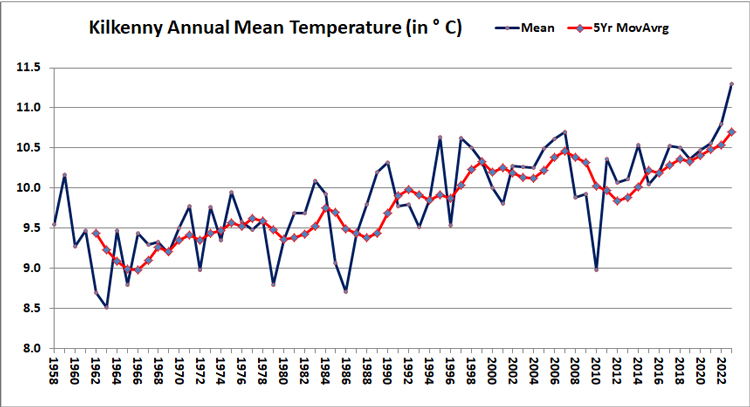
With a mean annual temperature of 11.2°, 2023 was easily the warmest year on record in Kilkenny. The 5 year moving average is also higher than any time before.
The table below shows the warming trend broken down month by month. So far this century all months have been warmer than 20th century figures
Compared with the 19th century monthly means, October is now almost 2° C warmer.
Jan |
Feb |
Mar |
Apr |
May |
Jun |
Jul |
Aug |
Sep |
Oct |
Nov |
Dec |
|
21st Century(2001-2021) |
5.3 |
5.7 |
7.0 |
9.2
|
12.0 |
14.7 |
16.2 |
15.8
|
13.9
|
10.8
|
7.4 |
5.6 |
20th Century(1961-1990) |
4.5 |
4.8 |
6.2 |
8.1 |
10.5 |
13.5 |
15.4 |
14.9 |
12.8 |
10.2 |
6.4 |
5.2 |
19th Century(1886-1900) |
4.1 |
4.7 |
5.7 |
8.3 |
10.9 |
14.4 |
15.2 |
14.8 |
12.9 |
8.9 |
6.7 |
4.8 |