Click on any graph title below, to view it in a separate window:
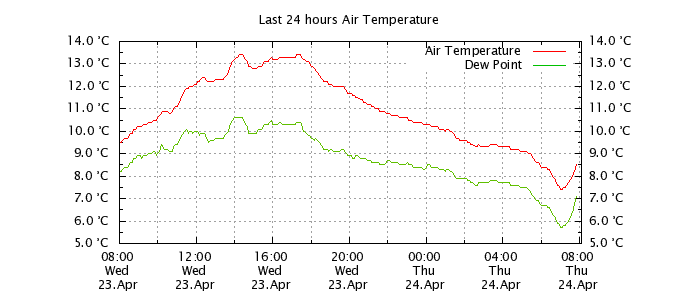
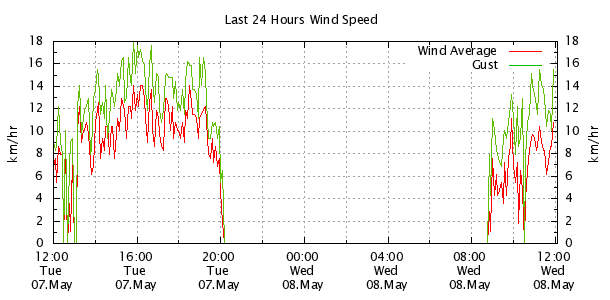
Note: When the weather is humid both red and green lines will be close together e.g foggy conditions.At times of low humidity the lines will be much further apart. This is often the case in the mid afternoon.
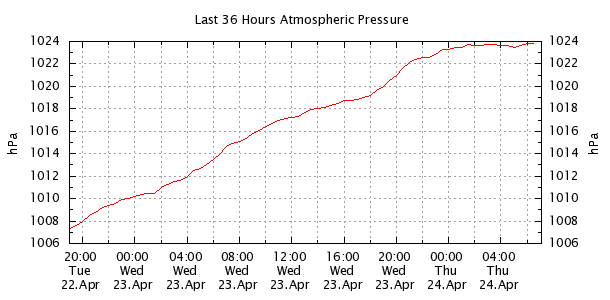
Note: Pressure rising steadily = turning fine / whereas pressure falling steadily = rain soon.
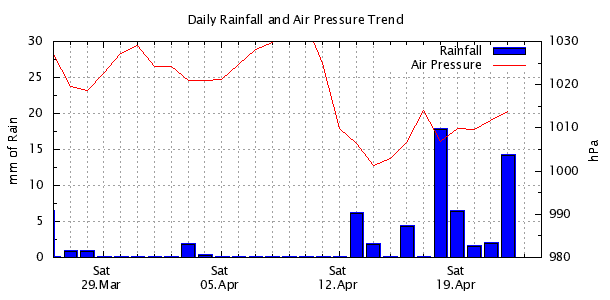
Note how rainfall often occurs when the atmospheric pressure (red line) is low and it is dry when pressure is high.